

 The Detroit MSA features a low unemployment rate, few foreclosures and the lowest mortgage payment-to-income ratio in the nation.
Exploring U.S. Housing Markets with Potential for Affordability
Many of the U.S. housing markets offering better affordability are concentrated in the Midwest and East Coast.
As inflation eases and mortgage rates are expected to decrease in the coming months, both homebuyers and sellers are likely to re-enter the market. For buyers, this could provide an opportunity to climb the housing ladder, secure more space, or move to a preferred location. For sellers, it might mean downsizing, upgrading, or relocating due to changes in personal circumstances like retirement, family growth, or financial adjustments.
Homebuyers often seek properties they perceive as affordable, which might include emerging neighborhoods not yet widely recognized, homes needing some renovations, or areas facing economic challenges. Conversely, some buyers might choose to invest in more expensive properties due to unique features or desirable locations that they plan to stay in for the long term.
In our analysis, we focus on metropolitan statistical areas (MSAs) where home prices and rents are relatively lower compared to local incomes. This could indicate potential for price growth and opportunities for both homebuyers and investors.
**Understanding Affordability**
The Department of Housing and Urban Development defines households spending more than 30% of their gross income on housing as “cost burdened.” This has become increasingly relevant in recent years due to rising inflation, which reduces disposable income for other necessities.
Instead of using household income, our analysis considers local per capita income as a measure of affordability. We identify markets as undervalued or overvalued based on how housing costs compare to the national per capita income. For this analysis, markets where housing costs are significantly lower than the national median per capita income are considered undervalued. Our data is sourced from the U.S. News Housing Market Index, which provides up-to-date insights into housing affordability across the nation.
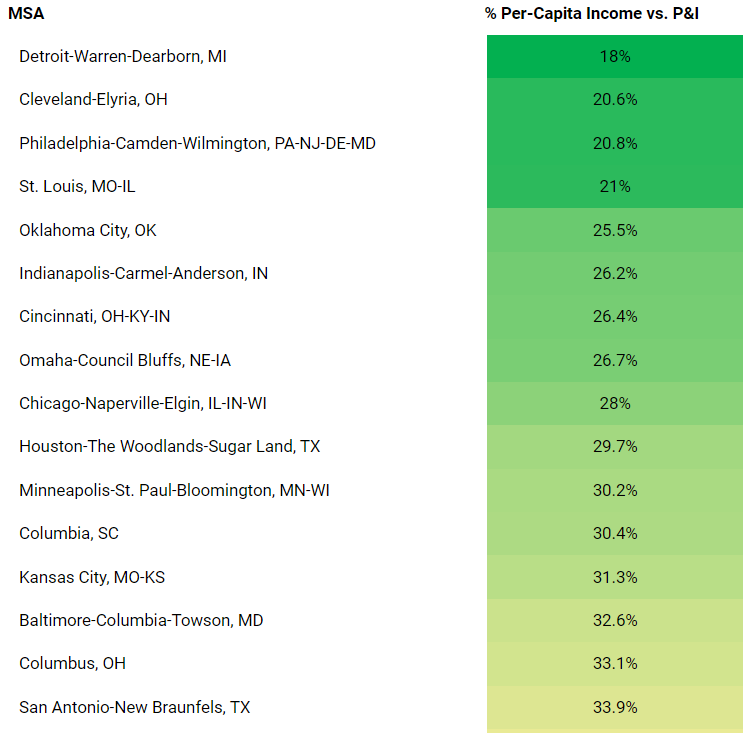
Data from May 2024 shows the following MSAs as having notably lower payment-to-income ratios, indicating potential affordability:
– Detroit – 18%
– Cleveland – 20.6%
– Philadelphia – 20.8%
– St. Louis – 21%
– Oklahoma City – 25.5%
These ratios are well below the national average of nearly 40%. The presence of former industrial cities like Detroit, Cleveland, and St. Louis among the most affordable markets reflects ongoing economic improvements and business development in these areas. For instance, Detroit’s median payment-to-income ratio of 18% is less than half the national average, highlighting its affordability relative to other markets.

The Most Undervalued MSA to Buy a Home
The Detroit MSA has a variety of strengths such as a low unemployment rate, few foreclosures and the country’s lowest mortgage payment-to-income ratio. Here’s a deeper look at the various data points regularly tracked by the Housing Market Interface for this MSA:
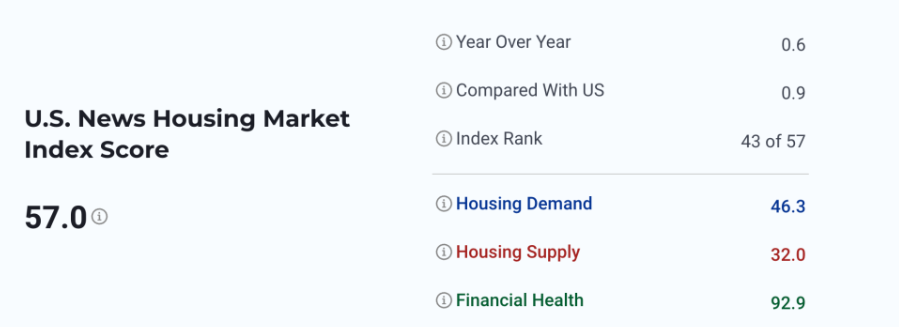
The overall Housing Market Index of 57 for the Detroit MSA rose 0.6 points year-over-year through May and is comprised of three subindexes on a 1-100 point scale, with 100 being the healthiest.
Demand HMI – 46.3
Supply HMI – 32
Financial – 92.9
Learn more about these subindexes and the data points they track.
Although the overall May HMI for the Detroit MSA of 57 is more than 8% below the national index figure of 61.8, its financial subindex of 92.9 is nearly 23% higher due to its lower ratio of housing costs to local incomes. However, limited supply may require potential homebuyers to be patient while awaiting the best listing for their needs.
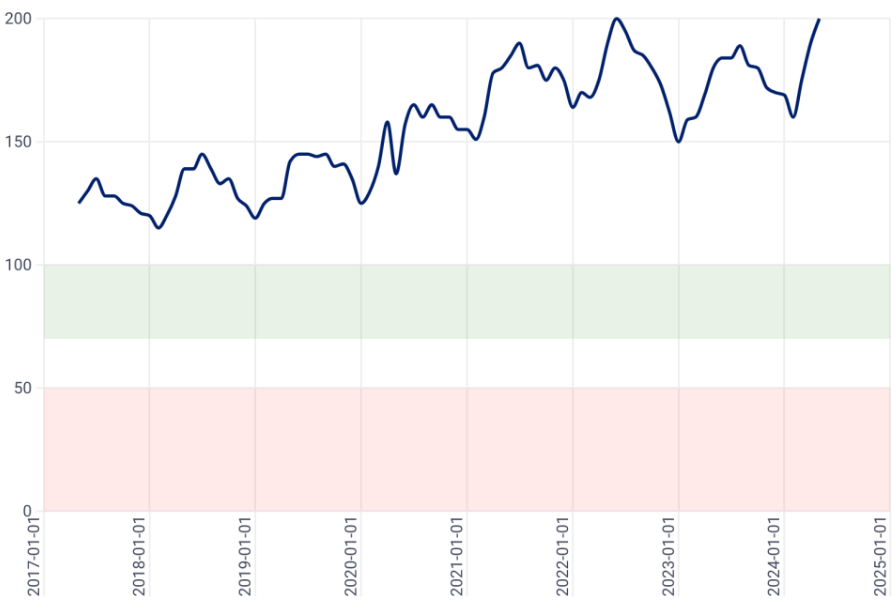
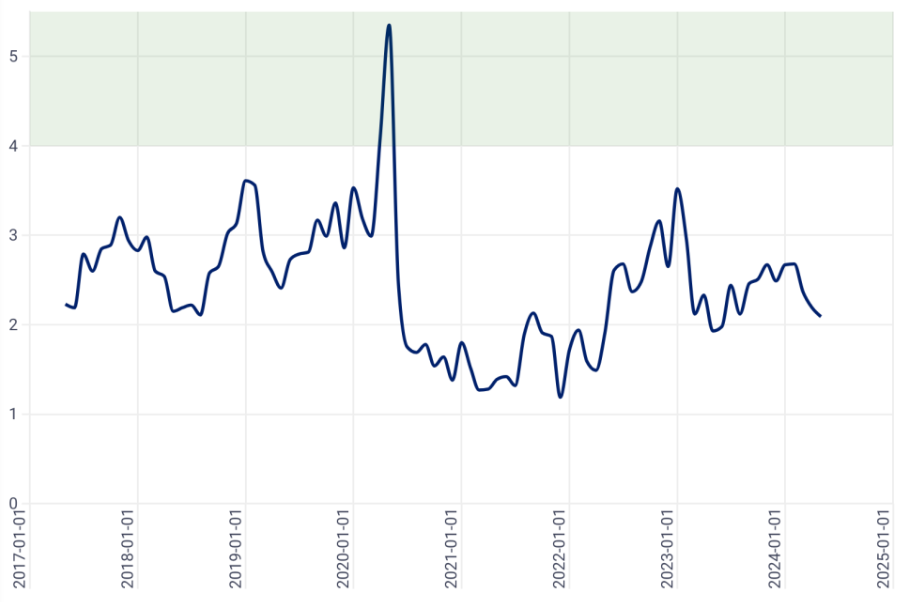
Detroit HMI History vs. U.S.
57.0 | +0.6 YOY
 |
|
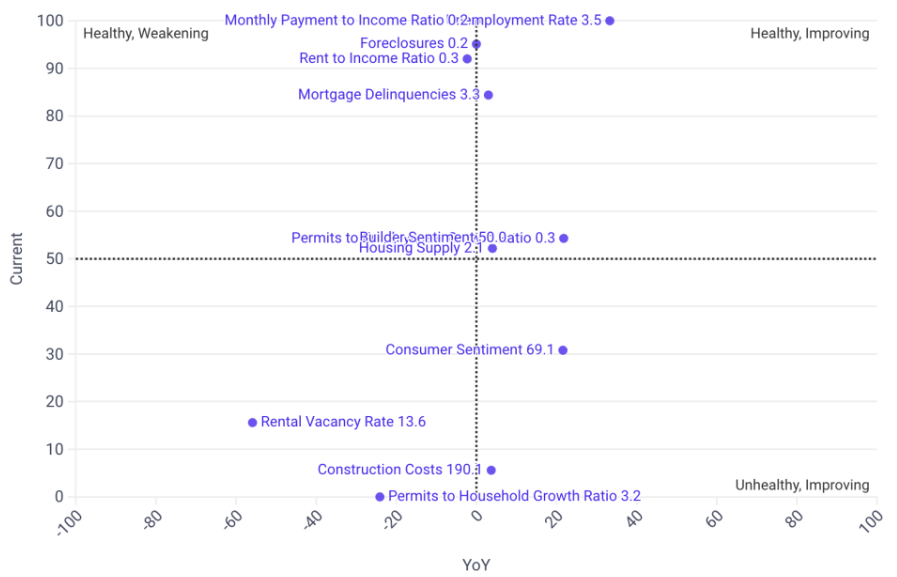
During the last year through May, while the HMI for Detroit edged up 0.6 points, it jumped 4.7 points for the nation due to improving housing supply, lower rent-to-income ratios and better consumer sentiment. Although Detroit enjoys a low unemployment rate, falling mortgage delinquencies and an increase in the number of homes for sale, it also reports few permits tied to household growth.
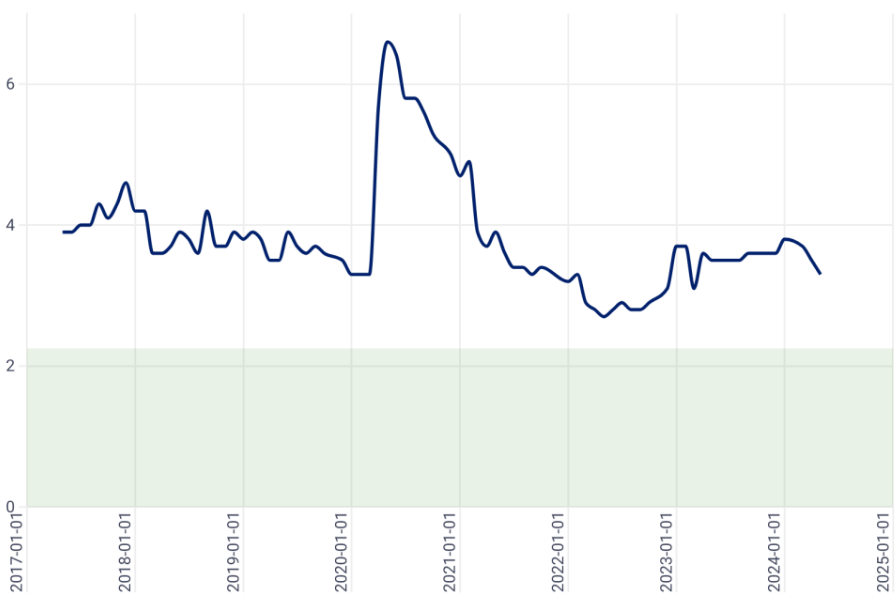
Detroit Median Sales Price
$200k | -1.1% YOY
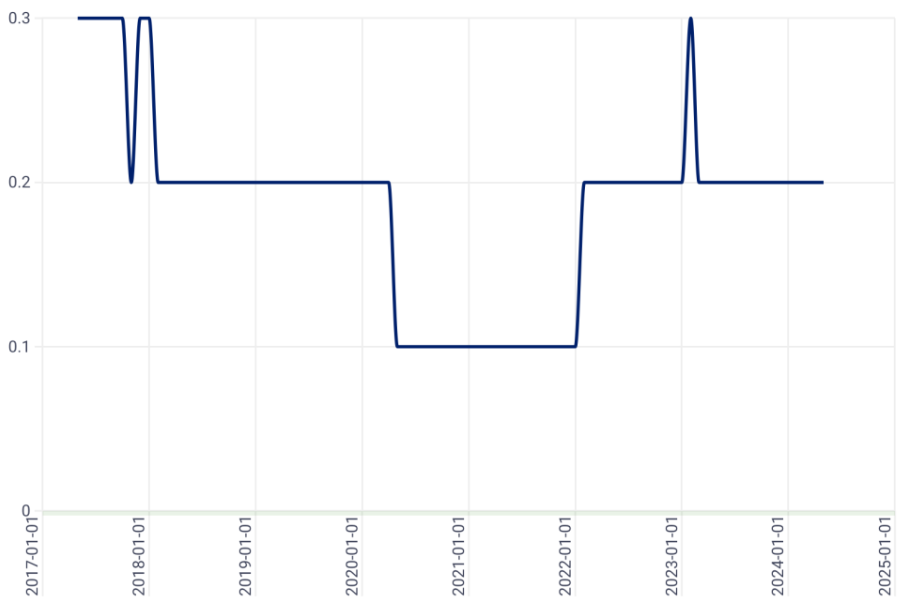
The median sales price in the Detroit MSA fell 1.1% over the past year to $200,000, which is also the lowest among the MSAs currently tracked by the Housing Market Index. At the same time, while housing supply here has risen slightly, it still stands at just 2.1 months. This level of supply is one-third to one-half of what is generally considered a balanced housing market.
Detroit Housing Supply
2.1 mo | +0.16% YOY
For the month of May, after falling 0.4% year-over-year, the mortgage delinquency rate of 3.3% in the Detroit area nearly matches the national level of 3.2%. Still, these rates could begin to increase if homeowners begin to struggle more with higher bills for property taxes and property insurance. For now, foreclosures in Detroit also remain at low levels, which are half the national average of 0.4%.
Detroit Delinquencies
3.3% | -0.4% YOY
Detroit Foreclosures
0.2% | -0.1% YOY
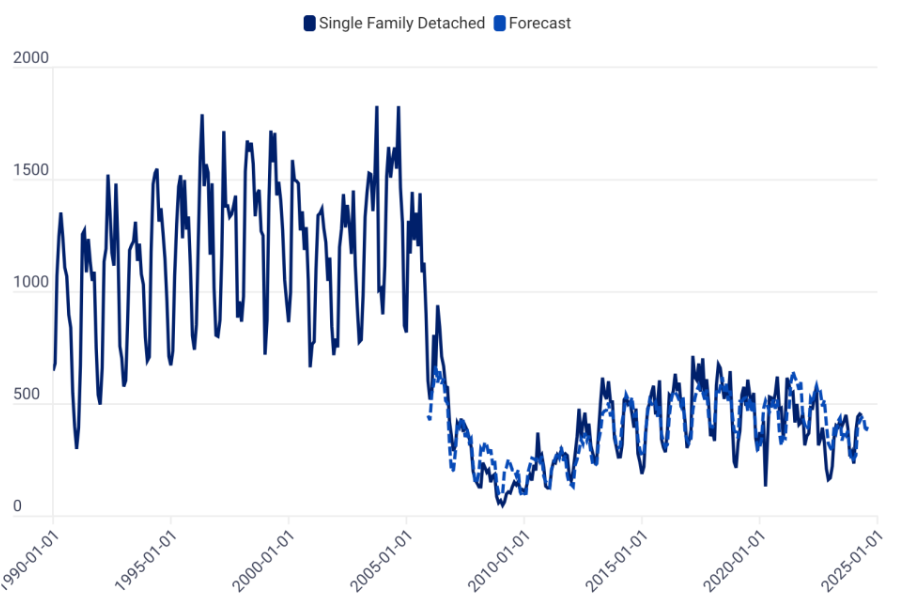
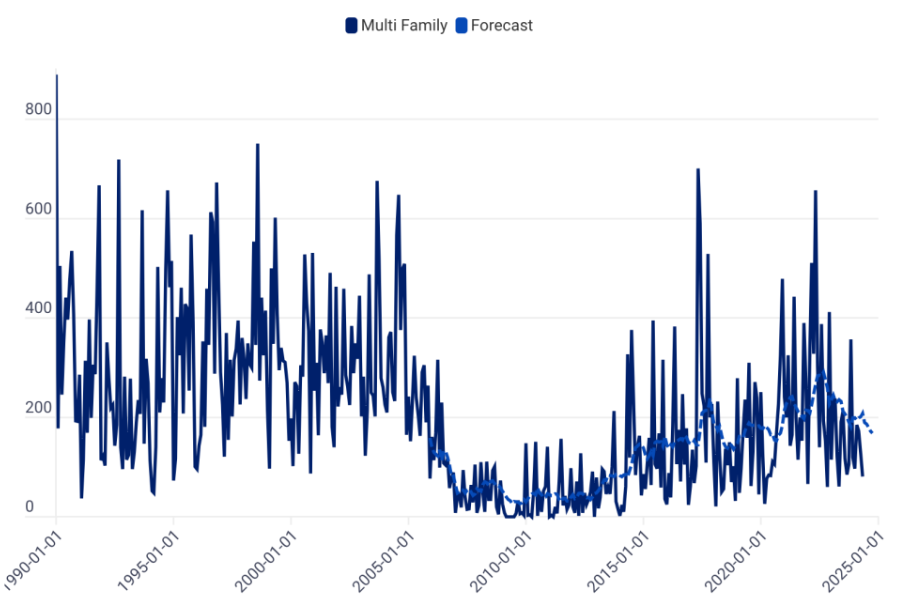
Single-Family Detached Permits
Multifamily Permits
Undervalued Homes for Rent
If you’re among the growing number of potential buyers waiting to decide on the right time to jump into the housing market, you may live in an MSA with a rent-to-income ratio far below the national median of 34.4%. In terms of undervalued rental housing markets, this list is again led by several markets in the Midwest in which this ratio ranges from about 21% to 25% of local per capita income:
Omaha, Nebraska – 21.3%
St. Louis – 22%
Oklahoma City – 23.9%
Minneapolis – 24.2%
(Tie) Indianapolis – 24.96%
(Tie) Cleveland – 24.98%